
Data Analytics
Turning messy business data into decisions people act on — Excel, SQL, Power BI, Tableau and Python — taught live by people who do it for a living.

- TEACHING
- 6 months
- PLACEMENT SUPPORT
- 3 months
- FORMAT
- Live · Saturday & Sunday
- CLASS SIZE
- 24, never more
- NEXT INTAKE
- Dates to come
- FEE
- £2,499
From spreadsheets to decisions, in the tools analysts actually use.
Most analyst roles run on the same five tools: Excel, SQL, Power BI, Tableau and Python. This programme teaches them in the order you’d meet them at work, starting with the business question and only then the tool.
You don’t need a coding or analytics background. Every module pairs a concept with a realistic scenario from retail, banking, healthcare or marketing, and ends with something you’ve built: a report, a query set, a dashboard. Classes are live at weekends with an instructor who works in the field, in a cohort of no more than 24, so questions get answered as they come up.
You finish with a portfolio, an industry capstone you can walk an interviewer through, and three months of placement support.
Is this the right course for you?
This is for you if…
- You are already in work and need one capability, quickly.
- You can commit two live sessions a week for twelve weeks.
- You want a capstone project you can take to an interview.
This is not for you if…
- You are changing career outright — a Post Graduate course gives you a portfolio, not one project.
- You need a regulated qualification for visa or professional registration. This is not one.
- You cannot attend live sessions. The recordings are a backup, not the format.
Twelve weeks, module by module
No competitor in this market publishes module-level detail. We do, because it is the thing you are actually buying.
- Weeks 1–2Introduction to data analyticsThe four types of analytics, data types and the analytics process, applied to retail, banking, healthcare and marketing.CONCEPTS
- Weeks 3–4Advanced ExcelCleaning and validation, pivot tables, XLOOKUP and IF, conditional formatting and a one-page report.EXCEL
- Weeks 5–6SQLFiltering, aggregation, joins, CASE, subqueries and a first look at window functions, on real business questions.SQL
- Weeks 7–8Power BIPower Query, data modelling, DAX and publishing a report a stakeholder can actually use.POWER BI · DAX
- Week 9TableauConnections, calculated fields, maps and dashboard actions, built into a story rather than a wall of charts.TABLEAU
- Weeks 10–12Python and statisticsNumPy, pandas and Seaborn, then distributions, outliers and correlation versus causation.PYTHON · PANDAS
Six things you can do on your first day as an analyst.
- Clean and summarise messy data in Excel, using pivot tables, lookups and a one-page report
- Write SQL that answers a real business question across several tables
- Build and publish a Power BI report that a stakeholder can actually use
- Turn the same data into a Tableau dashboard that tells a story
- Analyse and visualise data in Python, and check whether a pattern is real
- Explain your findings clearly enough that someone acts on them
You finish with work you can show, and people you can name.


Marcus Bell
Analytics Manager, Northgate
Teaches weeks 1–9

Dr Naomi Clarke
Lead Data Scientist, Halden Systems
Python, statistics and mock interviews

Next intakes for Data Analytics
The next Data Analytics dates are being scheduled. Book a call and we will tell you as soon as places are released.
Book a callPay in full
£2,499
Instalments
6 monthly payments of £416.50, no interest
Employer sponsorship
We invoice your employer directly
Refund
Full refund to end of week two
Three months of placement support.
It runs alongside and after the programme:
- Role mapping: which analyst, BI or reporting roles fit your background
- CV and LinkedIn rebuilt around tool-specific skills
- A target-employer shortlist and guidance on where to apply
- Mock interviews and professional communication coaching
- Salary negotiation preparation
- What UK employers expect at CV, interview and offer stage
Asked before every Data Analytics cohort
Do I need to know how to code before I start?
No. The first four weeks are analytics concepts and Excel, and SQL starts in week five from the very beginning. Python comes last, once you are comfortable with data. What you do need is to put the practice hours in between sessions.
How much maths is there, honestly?
Less than you fear. You need to be comfortable with percentages, averages and reading a chart. The statistics you need are taught from first principles — no calculus, no proofs.
Does this cover GenAI?
Only where it helps an analyst day to day, such as AI-assisted features inside Excel and Power BI. The full GenAI half is taught on Data Analytics + Generative AI, our Post Graduate course, and on the Generative AI course.
Which tools will I use, and are they free?
Excel, Power BI, Tableau, SQL (MySQL or SQL Server) and Python in Jupyter or Google Colab. We’ll tell you what to install before week one and which tools have free versions.
Can I choose the industry for my capstone?
Yes. Your capstone is shaped around the industry you want to work in — technology, finance, banking, healthcare, hospitality and travel, consulting, retail, or supply chain and operations — with real-world-style data and a portfolio-ready result.
What if I miss a session?
The recording is up the same day and your mentor covers it in your next 1:1. Attendance matters for the certificate — you need 80% across the programme — but a handful of missed sessions will not put that at risk.
What can I do after this course?
Graduates can step up to Data Analytics + Generative AI, our Post Graduate programme, which adds machine learning and GenAI to this foundation.
Already hold an Ashwood certificate?
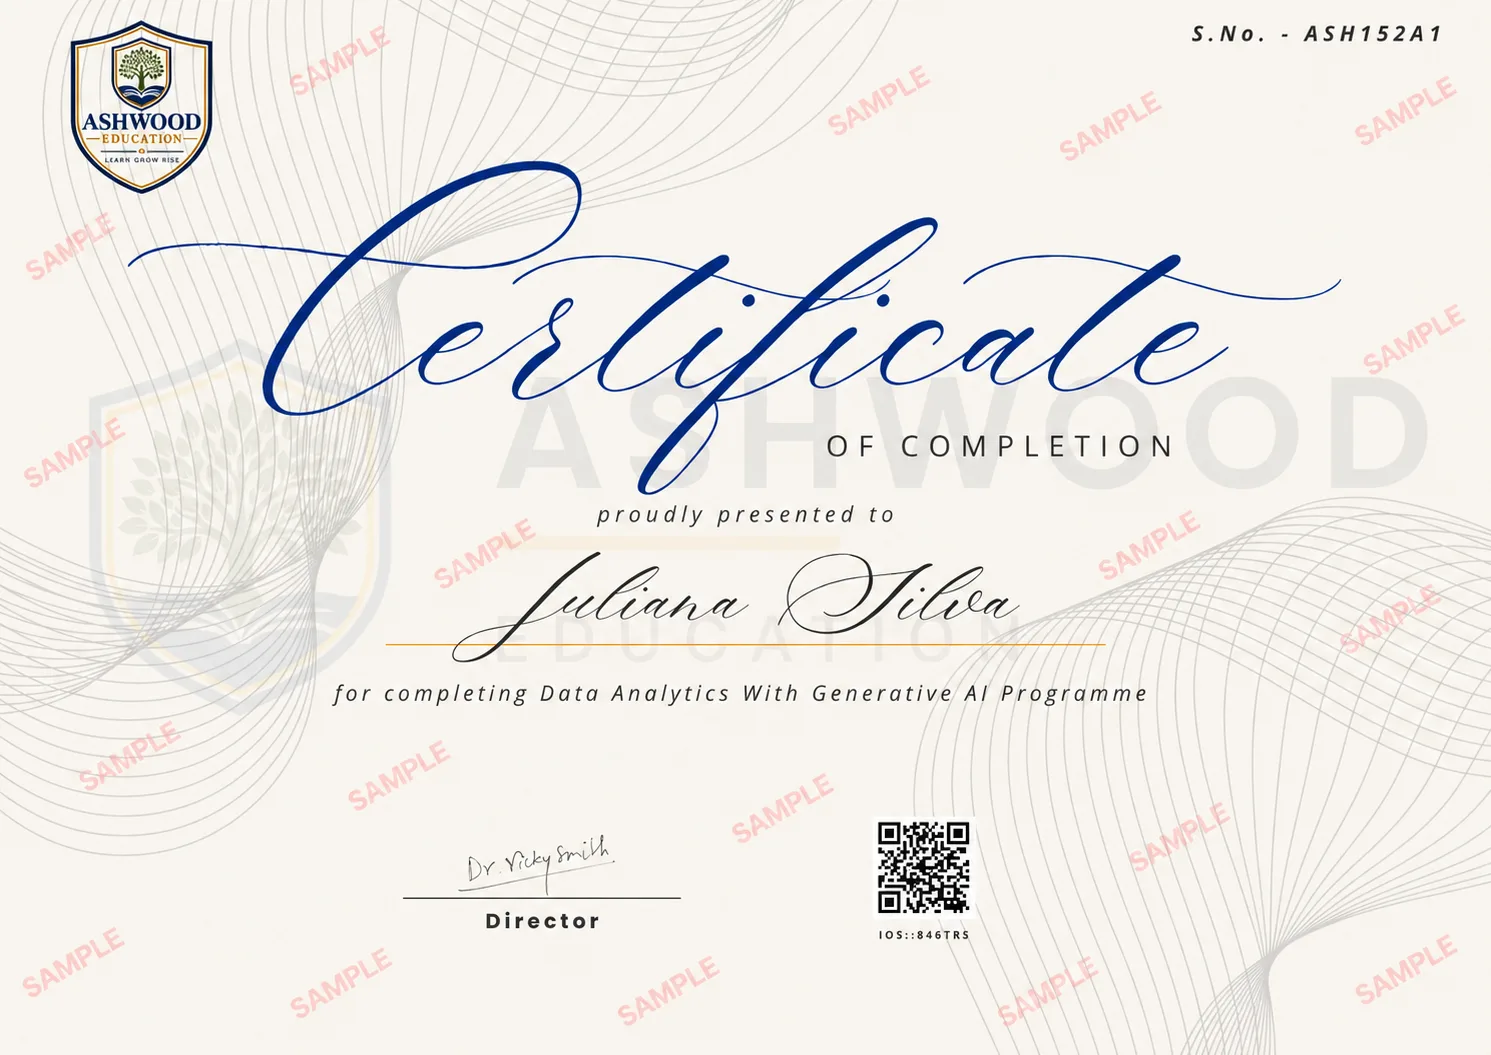
Employers and graduates can check any certificate number in seconds.